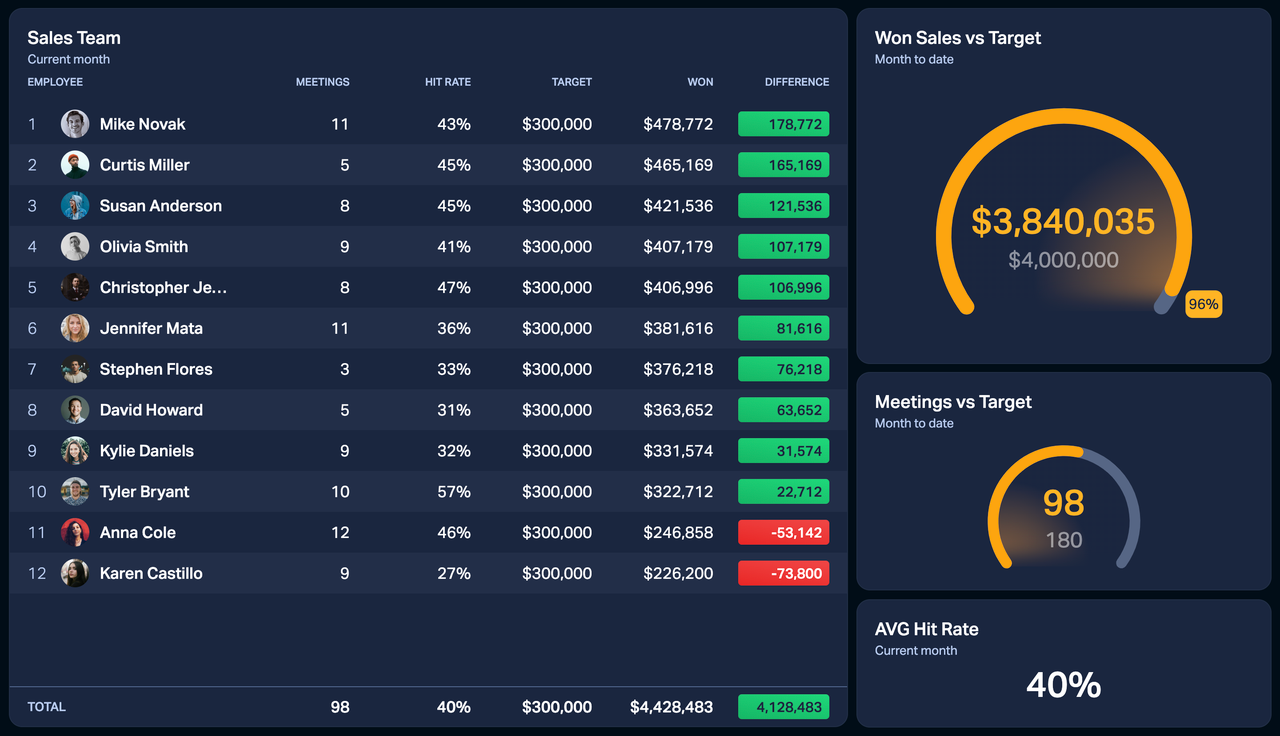
Table widget on dashboards
One column = one formula. The table widget is highly customizable and offers a great overview of your KPIs.
Add unlimited columns. Or, until there's no more space on your screen.
See conditional colors and employee achievement badges.
Sort the table columns. Click on the three little dots in the top-right corner of a column to sort it.
Show average or total values for each column by adding a summary heading.
Reorganize the columns using drag-and-drop.
Group your data by employees, teams, time, or custom fields from your data sources using the Group by option.
How to add a table widget
Open your dashboard, then click Add widget and select Table.
Hold the click button on your mouse and drag the widget onto the dashboard.
Click Add column and select a formula. You can add as many columns as you want and create new formulas right from the widget by clicking the New button.
(Optional) Give each column a title that describes the added formula.
(Optional) Give your table widget a title.
Adjust the settings such as the layout, grouping, time period, and others.
Click Save widget to finish.
How to sort table columns
Column sorting depends on how you group the data on the table widget.
To sort the data, click on the three dots in the column header and choose your preferred sorting style.
If a column is sorted, you will see a little triangle in the header. To revert to the default sorting, click the dots again and deselect the current sorting style.
Table widget settings
Group by: Group your data in the left column by employees, teams, time, or custom fields from a data source.
Custom field: Grouping data by a custom field from a data source only works when using formulas based on that same data source. If you add a formula that combines data from multiple data sources and group it by a field from one data source, you might not get any results.
Filter by team(s): If applied, this filter will show data for employees from the selected teams. If no teams are selected, the widget will use data for all teams in your organization.
First column: Customize the look of your widget by displaying avatars, names, or just your data.
Show totals/average at the bottom: See the total value of your formula result. To get the totals, Plecto looks at the selected time period and calculates totals of all your data, regardless of how many rows are visible on the widget.
Hide rows with zero and negative values: If selected, Plecto will look at the sorted column and hide all rows with negative values, including 0. It means that it might exclude values from other columns on the same row, even if they show positive values.
Limit the number of rows: Choose how many rows are visible on the table widget. Limiting rows doesn't affect the table totals.
Abbreviate large numbers: Instead of $24 325 show $24,3k.
Time period: Choose how much data you want to display on your widget by selecting a time period.
Employee status and substatus: These options apply for streaming data types. For more info on streaming metrics, go to the Streaming Metrics guide.

