

Area and Line charts
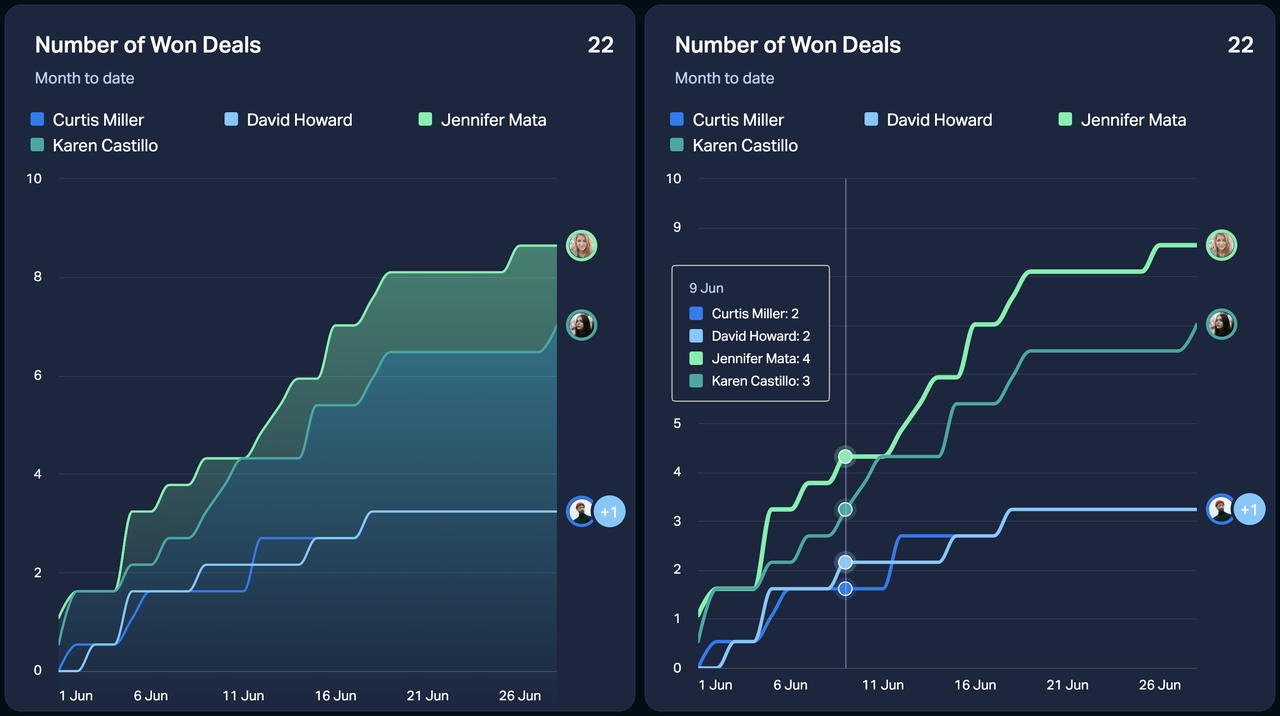
The area and line charts are very similar – the only difference is that the area chart highlights the data areas. The Y axis range on the charts adjusts automatically based on your data.
Here's how you can use the line and area charts:
Add two formulas to the chart to keep track of two metrics.
Add one formula and compare it to a previous time period.
Add one formula and group your data by employees, teams, or custom fields.
Show a summary in the top-right corner. You can choose to show the Total, Average or Last values.

Time period options for Area & Line charts
Granularity
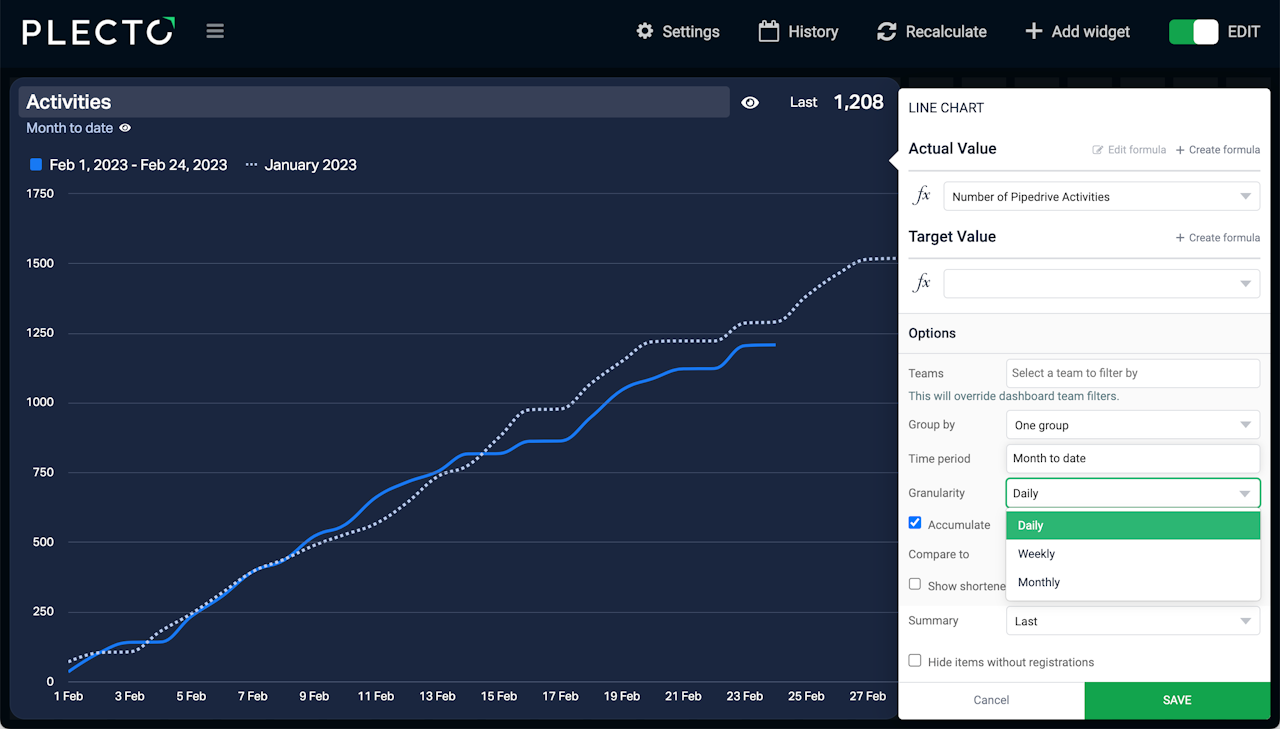
Granularity allows you to break up the data points on your line and area charts. The granularity options depend on your chosen time period.
When showing years, you can use the quarterly, monthly, and weekly granularity.
When showing quarters, you can use the monthly, weekly, and daily granularity.
When showing months, you can use the monthly, weekly, and daily granularity.
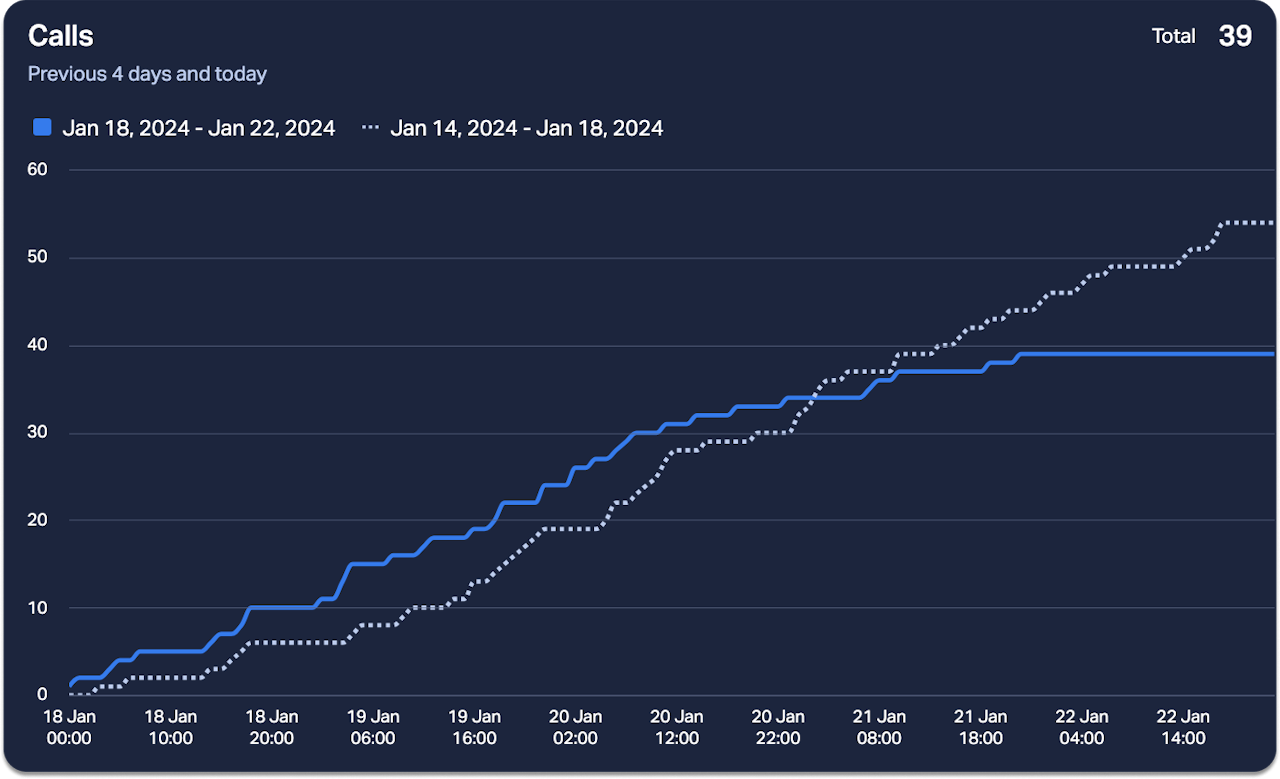
When showing days, you can use the daily and hourly granularity. Note that hourly granularity is limited to 4 days.
Accumulate
Accumulate the data points and track the total progress of your performance. For example, use it to see the total value of closed deals, completed tasks, or others, within your chosen time period.
Compare data to last time period
If the Group by option is set to None, you can compare the current KPI to the previous time period – for example, see the number of deals this month vs. last month, calls today vs. yesterday, and so on.
If you select to-date time periods such as Week to date or Month to date, you can compare the data to the last to-date period or last full period.
For example, if the selected time period is Month to date, you can compare it to Previous period (previous month to date) or Last month (the entire last month).

