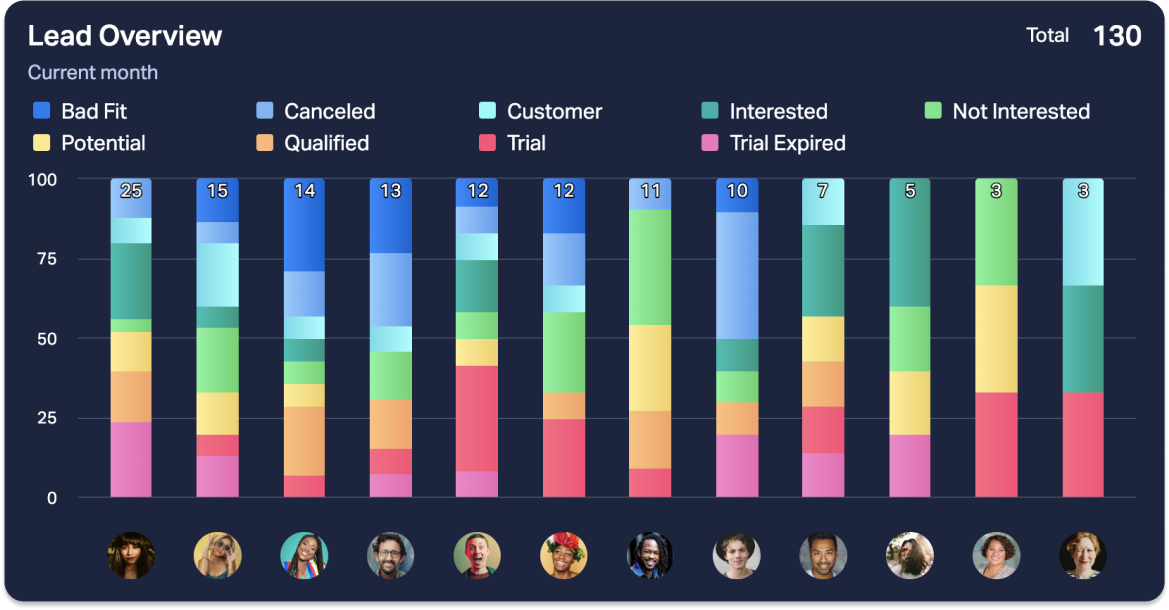

Column chart
Here's what you can do with the column chart:
Group your data by employees, teams, time, or custom fields from the relevant data sources.
Grouping by time enables you to select a time period granularity.
If you show data with a daily granularity, you can choose to hide the weekends (Saturday and Sunday). This setting is purely visual and will not change the formula result.
Sort the columns alphabetically or by highest/lowest values.
Show employee and team names or their avatars.
Stack the columns: Visualize multiple dimensions from a single formula. Stacked columns allow you to compare the total values and single parts.
Filter by team(s): If applied, this filter will show data for employees from the selected teams. If no teams are selected, the widget will use data for all teams in your organization.
Vertical and horizontal columns: Customize the layout of your column chart.
Show Total or Average summary values in the top-right corner of the widget.
Abbreviate large numbers: Instead of $24 325 show $24,3k.
