Pie chart
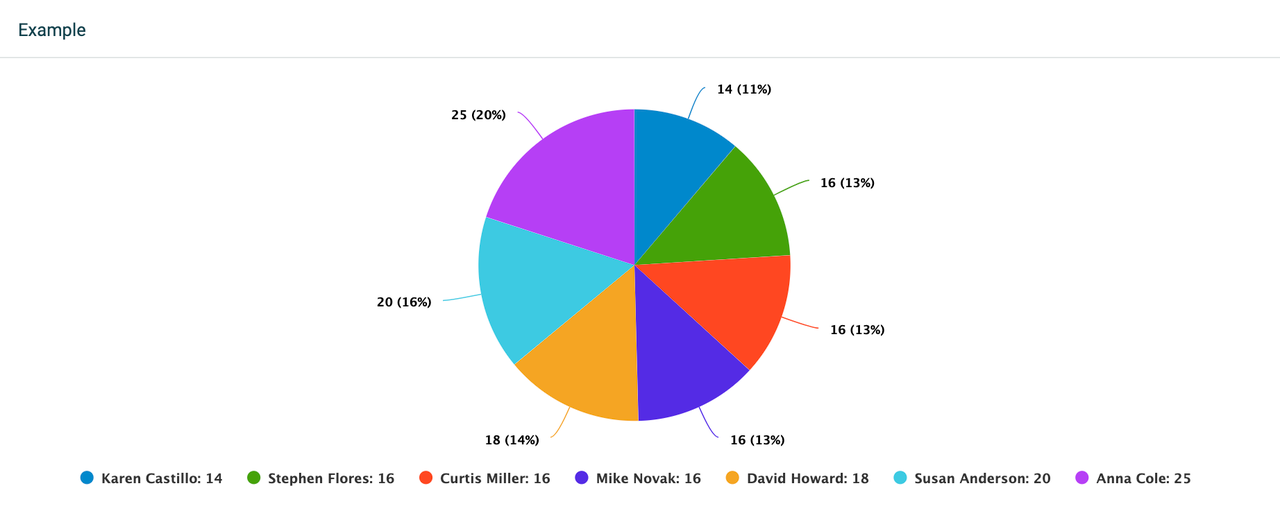
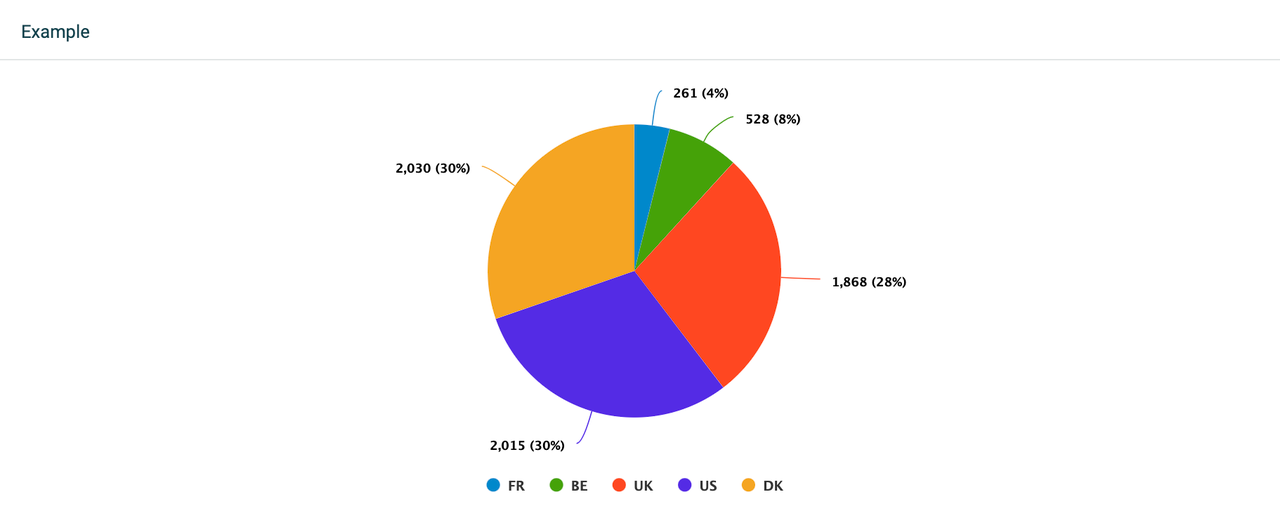
The pie chart allows adding up to 20 KPIs. Add an existing formula, edit it, or create a new formula right from the widget settings menu. You can also choose to drill down your metrics by specific parameters, based on the fields available in your data source that the formulas are built on.
For example, if you display the number of support cases for the current month, you can drill the data down by medium to see how many cases were treated over different communication channels, or by employee to see the number of cases completed by each support agent.

Group by Time or KPIs
The pie chart allows you to group data by Time or by KPIs:
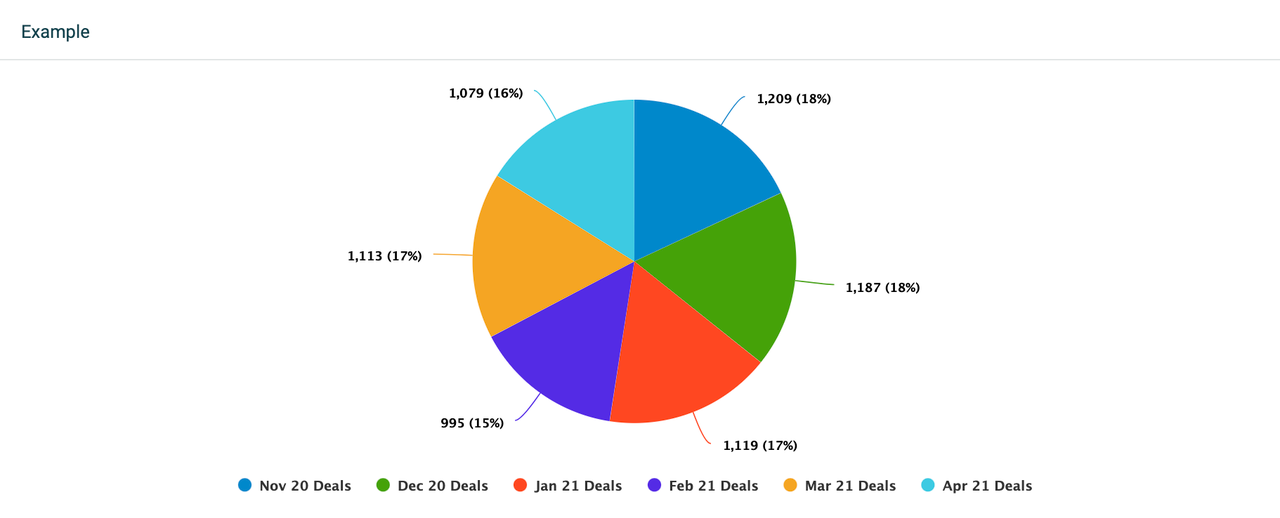
Time: This grouping option is available when one KPI with no drilldowns is added to the chart. It will then enable different grouping periods, depending on the selected time period.
For example, if you look at data from the previous month, the widget will allow you to select between a daily, weekly, or monthly grouping. If you look at data from the current year, the widget will allow you to group data monthly, quarterly, or annually.KPIs: Grouping by KPIs enables you to look at one segment per KPI, or if you have selected any drilldowns - one segment per drilldown. The widget will display as many segments as the number of KPIs or drilldowns you have added to it.
Filter data by
These filtering options are common for all widgets:
If you want to see all data, select Filter data by > All.
If you want to see data from specific teams or employees, select either the Teams or Employees option and add the teams or employees from the list.
Customize
Feel free to customize your chart. When editing, go to the Customize section in the upper-right corner. From there, you can add data labels, sort, adjust legend settings, or turn your pie into a donut! 🍩

