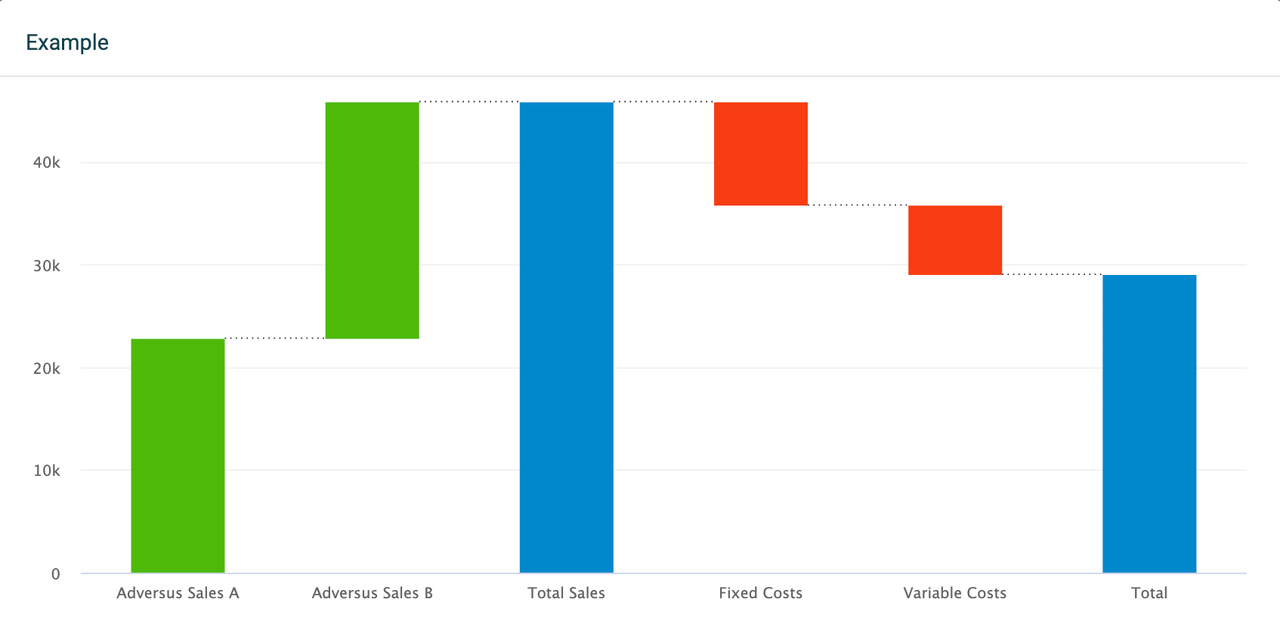
Waterfall chart
Track changes in your KPIs and look at your revenue, budget, net profit, or other data with a waterfall chart. The waterfall chart is useful for understanding how a starting value develops into an end value through a sequence of positive or negative changes. The waterfall chart in Plecto is highly customizable and offers many configuration options.
Data and KPIs
There are several ways you can visualize data on a waterfall chart. Add up to 20 KPIs, set a start value, add target formulas, intermediate sums, or drill down your metrics on each KPI by specific parameters. The parameters are based on the fields available in your data source that the formulas are built on.
The waterfall chart will show a running total as positive or negative values are added to your data.
To observe deviations in your data with positive or negative values, you need to compare your KPIs to either another time period or a target KPI. This will allow you to see direct comparisons between the current data and your targets/past data.
You can also enable a start value in the form of a KPI that the other KPIs will be measured up against.
Read more about the start value and comparing options in the sections below.

Start value
Add a start value to your waterfall chart which will create a new Start value column on the left side of the chart. The start value represents one formula that the other KPIs are measured up against.
Decide if you want to display the start value from the same time period or a previous period:
Selecting the same time period allows you to look at current values. For example, Yearly Budget compared to Actual Revenue.
Selecting a previous period allows you to look at the same values for both the current and past periods. For example, Revenue This Year compared to Last Year.

Intermediate sum
See subtotals and get a good overview of your data with intermediate sums.
Click Edit in widget's top-right corner.
Scroll down to the section Intermediate sum.
Click Add intermediate sum, then select Position after > [KPI of your choice].
It will insert an intermediate sum column in the chart and display the sum of the KPIs to its left. This can be very useful when displaying gross vs. net values, EBITDA, quarterly overviews, etc.
Compare to another time period
Compare to none
This option allows you to drill down your metrics for each added KPI, but you will not be able to add a target KPI.
Compare to another time period
The comparing options will depend on your selected time period. For example, if you display data for the current month, you'll be able to compare data to the same month last year. If you display data for the current week, the widget will allow you to compare data to the same week last month, etc.
Compare to a target KPI
If selected, it will add a column called Start value on the left side of the chart and require selecting a target formula for every single KPI that has been added to the waterfall chart. The column will then display a sum of all the selected targets.
You can also rename the start value column to match your needs. Expand the Start value field and enter a new title.

Group by Time or KPIs
The waterfall chart allows you to group data by Time or KPIs.
Time: Display your selected KPIs on a timely basis, depending on the selected time period. For example, if you look at data from the previous 3 months, the widget will allow you to select between a daily, weekly, or monthly grouping. If you look at data from the current year, the widget will allow you to group data monthly, quarterly, or annually. If your chart contains multiple KPIs, they will be stacked.
KPIs: Look at one column per KPI, or if you have selected any drilldowns - one column per drilldown. The widget will display as many columns as the number of KPIs or drilldowns you have added to it. Grouping data by KPIs allows you to select drilldowns for each of the added KPIs.

Filter data by
These filtering options are common for all widgets:
If you want to see all data, select Filter data by > All.
If you want to see data from specific teams or employees, select either the Teams or Employees option and add the teams or employees from the list.

